| # | saison | Buts | Matches | Ø Buts |
|---|---|---|---|---|
| 1 | 1962 Éthiopie | 18 | 4 | 4.5000 |
| 2 | 1963 Ghana | 33 | 8 | 4.1250 |
| 3 | 1965 Tunisie | 31 | 8 | 3.8750 |
| 4 | 1957 Soudan | 7 | 2 | 3.5000 |
| 5 | 1972 Caméroun | 53 | 16 | 3.3125 |
| 6 | 1968 Éthiopie | 52 | 16 | 3.2500 |
| 7 | 1970 Soudan | 51 | 16 | 3.1875 |
| 8 | 1974 Égypte | 54 | 17 | 3.1765 |
| 9 | 2008 Ghana | 99 | 32 | 3.0938 |
| 10 | 1976 Éthiopie | 54 | 18 | 3.0000 |
| 11 | 1998 Burkina Faso | 93 | 32 | 2.9063 |
| 12 | 2004 Tunisie | 88 | 32 | 2.7500 |
| 13 | 1996 Afrique du Sud | 78 | 29 | 2.6897 |
| 14 | 1959 Égypte | 8 | 3 | 2.6667 |
| 15 | 2010 Angola | 71 | 29 | 2.4483 |
| 16 | 2012 Gabun und Äquatorialg. | 76 | 32 | 2.3750 |
| 17 | 2024 Elfenbeinküste | 119 | 52 | 2.2885 |
| 18 | 2000 Ghana/Nigeria | 73 | 32 | 2.2813 |
| 19 | 2006 Égypte | 73 | 32 | 2.2813 |
| 20 | 1978 Ghana | 36 | 16 | 2.2500 |
| 21 | 1994 Tunisie | 44 | 20 | 2.2000 |
| 22 | 1984 Côte d'Ivoire | 35 | 16 | 2.1875 |
| 23 | 2013 Südafrika | 69 | 32 | 2.1563 |
| 24 | 2015 Equatorial Guinea | 68 | 32 | 2.1250 |
| 25 | 2017 Gabun | 66 | 32 | 2.0625 |
| 26 | 2019 Ägypten | 102 | 52 | 1.9615 |
| 27 | 1986 Égypte | 31 | 16 | 1.9375 |
| 28 | 1982 Libye | 30 | 16 | 1.8750 |
| 29 | 1990 Algérie | 30 | 16 | 1.8750 |
| 30 | 1980 Nigéria | 29 | 16 | 1.8125 |
| 31 | 2022 Kamerun | 94 | 52 | 1.8077 |
| 32 | 1992 Sénégal | 34 | 20 | 1.7000 |
| 33 | 2002 Mali | 48 | 32 | 1.5000 |
| 34 | 1988 Maroc | 19 | 16 | 1.1875 |
| ∑ | au total 34 | 1866 | 794 | Ø 2.35 |

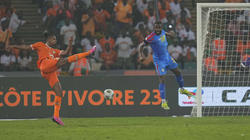
 von der Elfenbeinküste im Kopfballduell mit Semi Ajayi.")